
Cardiac Calcium Imaging and Calcium Transient Analysis
Intracellular calcium signals link cardiac electrical activity to contraction. Recording changes with fluorescent calcium indicators allows analysis of transient amplitude, kinetics and rhythm, supporting investigation of compound effects on calcium handling.
Cardiac calcium imaging supports cardiovascular research and early discovery through comparisons at cellular and tissue-like levels. We emphasize standardized experimental conditions, interpretable metrics and clear data presentation. Applications include quantitative transient and beat-to-beat stability analysis, exploratory comparison of compound effects, functional phenotyping of rhythm-related changes and mechanistic studies of targets involved in excitation-contraction coupling.
Supported Research Models
The service covers primary cardiomyocytes, iPSC-derived cardiomyocytes, and cardiac organoids or cardiac tissue-like preparations. Model source, culture maturation, tissue thickness and optical access influence assay selection and interpretation.
- Primary cardiomyocytes, including primary rodent preparations selected from neonatal or adult tissue according to the study.
- iPSC-derived cardiomyocytes, including human models with documented differentiation, maturation and culture format.
- Cardiac organoids and cardiac tissue-like models, including suitable cardiac microtissues after assessment of optical access and model-specific feasibility.
Model type, spontaneous or paced activity, temperature and treatment conditions are specified before comparison. In three-dimensional preparations, the imaged region is not assumed to represent the entire tissue volume.
Key Evaluation Parameters
| Evaluation area | Analysis scope |
|---|---|
| Calcium transient amplitude | Peak values, relative fluorescence changes and baseline changes. |
| Calcium handling kinetics | Rise time, time to peak, decay time and transient width. |
| Rhythm and abnormal signals | Frequency, beat-to-beat variability, irregular transients and additional calcium release events. |
| Spatial activity | Activation timing and regional consistency within resolvable regions, with propagation analysis under suitable conditions. |
Routine fluorescence measurements are used to analyze relative calcium signals. Absolute calcium concentrations require an appropriate indicator and calibration; uncalibrated fluorescence intensity cannot be directly converted into calcium concentration.
Normalized signals are compared under defined conditions. Indicator kinetics, loading and baseline selection are reported where they affect interpretation. Regional activation, synchrony and propagation analysis require adequate spatial and temporal resolution; additional release events are assessed only where identifiable.
Functional Signal Examples
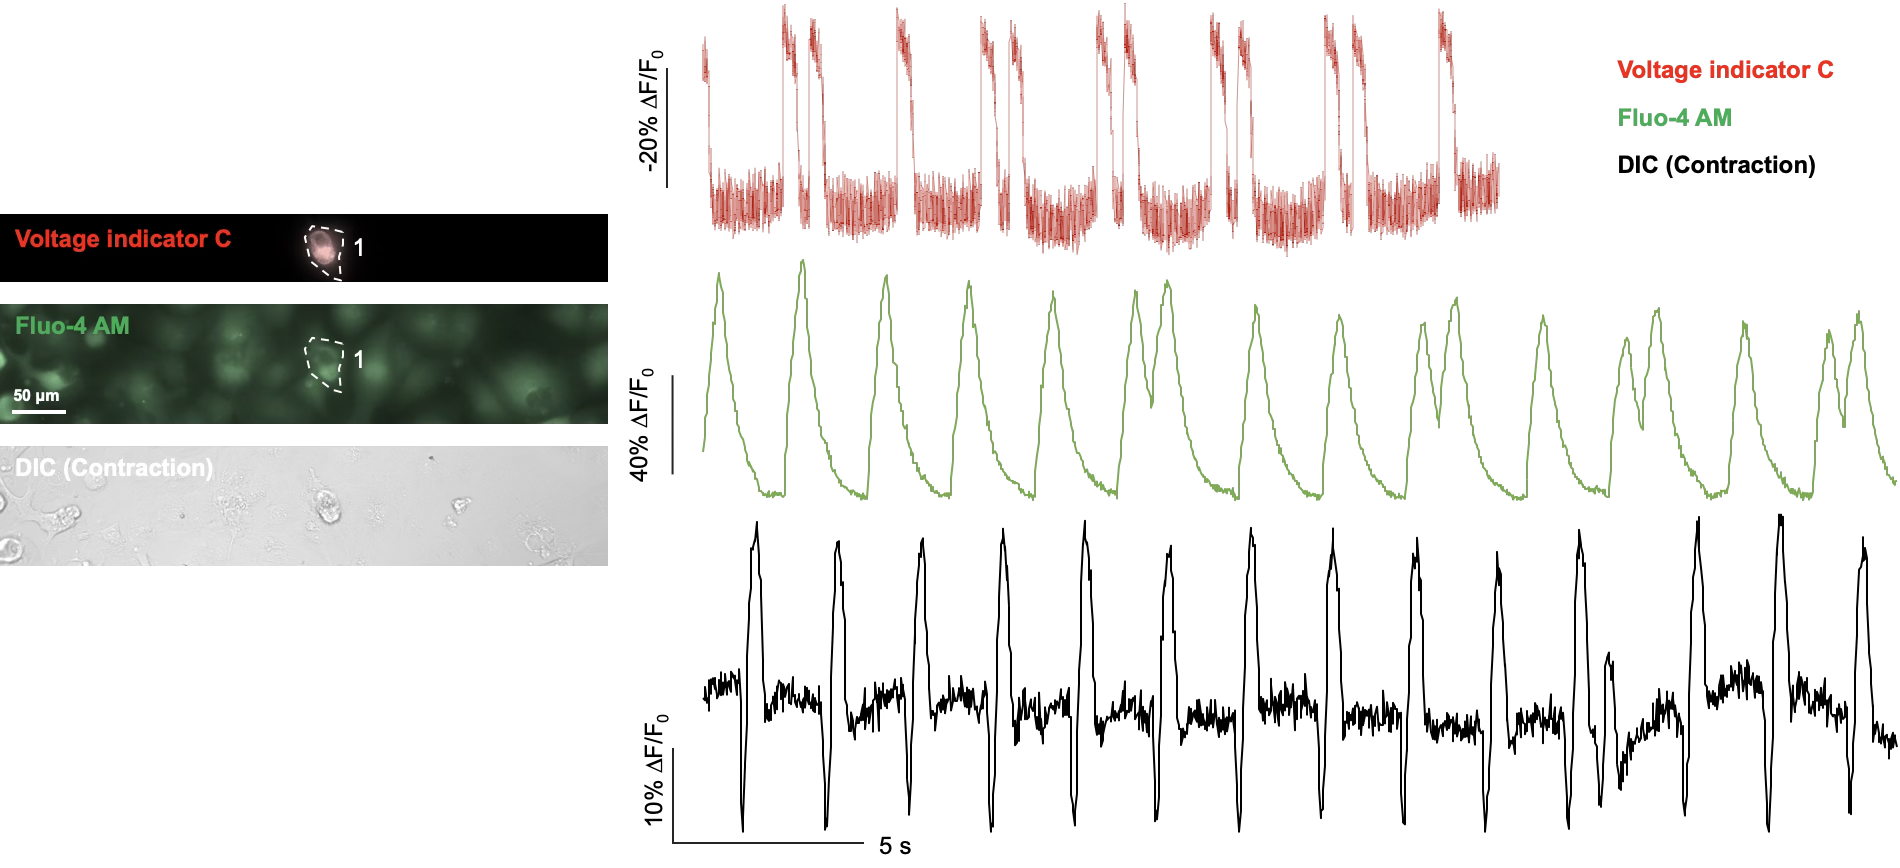
Calcium signals can be analyzed alongside voltage and contraction signals to help distinguish altered electrical activity, calcium handling and mechanical responses. The study specifies whether signals are acquired simultaneously or in separate, matched experiments.
Cardiac Calcium Imaging Example

Study Design, Quality Control and Deliverables
The model, treatment concentrations, exposure times, controls and replication are agreed according to the research objectives. Baseline measurements, stimulation or pacing where applicable, and treatment comparisons are defined for the study. Acquisition, processing and quality control use consistent settings; customization is assessed for each project.
Results are analyzed alongside sample condition and quality-control information. Checks address background fluorescence, photobleaching, motion, ROI selection and event detection. Model and acquisition limitations accompany the analysis.
- Description of the indicator, acquisition regions, background correction and methods used to address motion.
- Calcium transient traces, agreed kinetic parameters and between-group comparisons.
- Joint analysis with voltage or contraction endpoints, with an explanation of the applicable scope.
- Image sequences, normalized traces, kinetic and rhythm metrics, representative data visualizations, group summaries and documented exclusions as agreed in the study.
A structured report records the methods and findings for scientific review and research decisions.